Beyond Infographics: Interactive Data Storytelling for the Digital Age
Last update: 10 September 2025 at 12:28 am
 5.00/5
Information has been the gold standard that delivers phenomenal outcomes for businesses irrespective of the industry verticals they operate. But the presentation of the information too matters.
In such a situation, how can we connect and convince our audience rather than simply deliver facts from raw data?
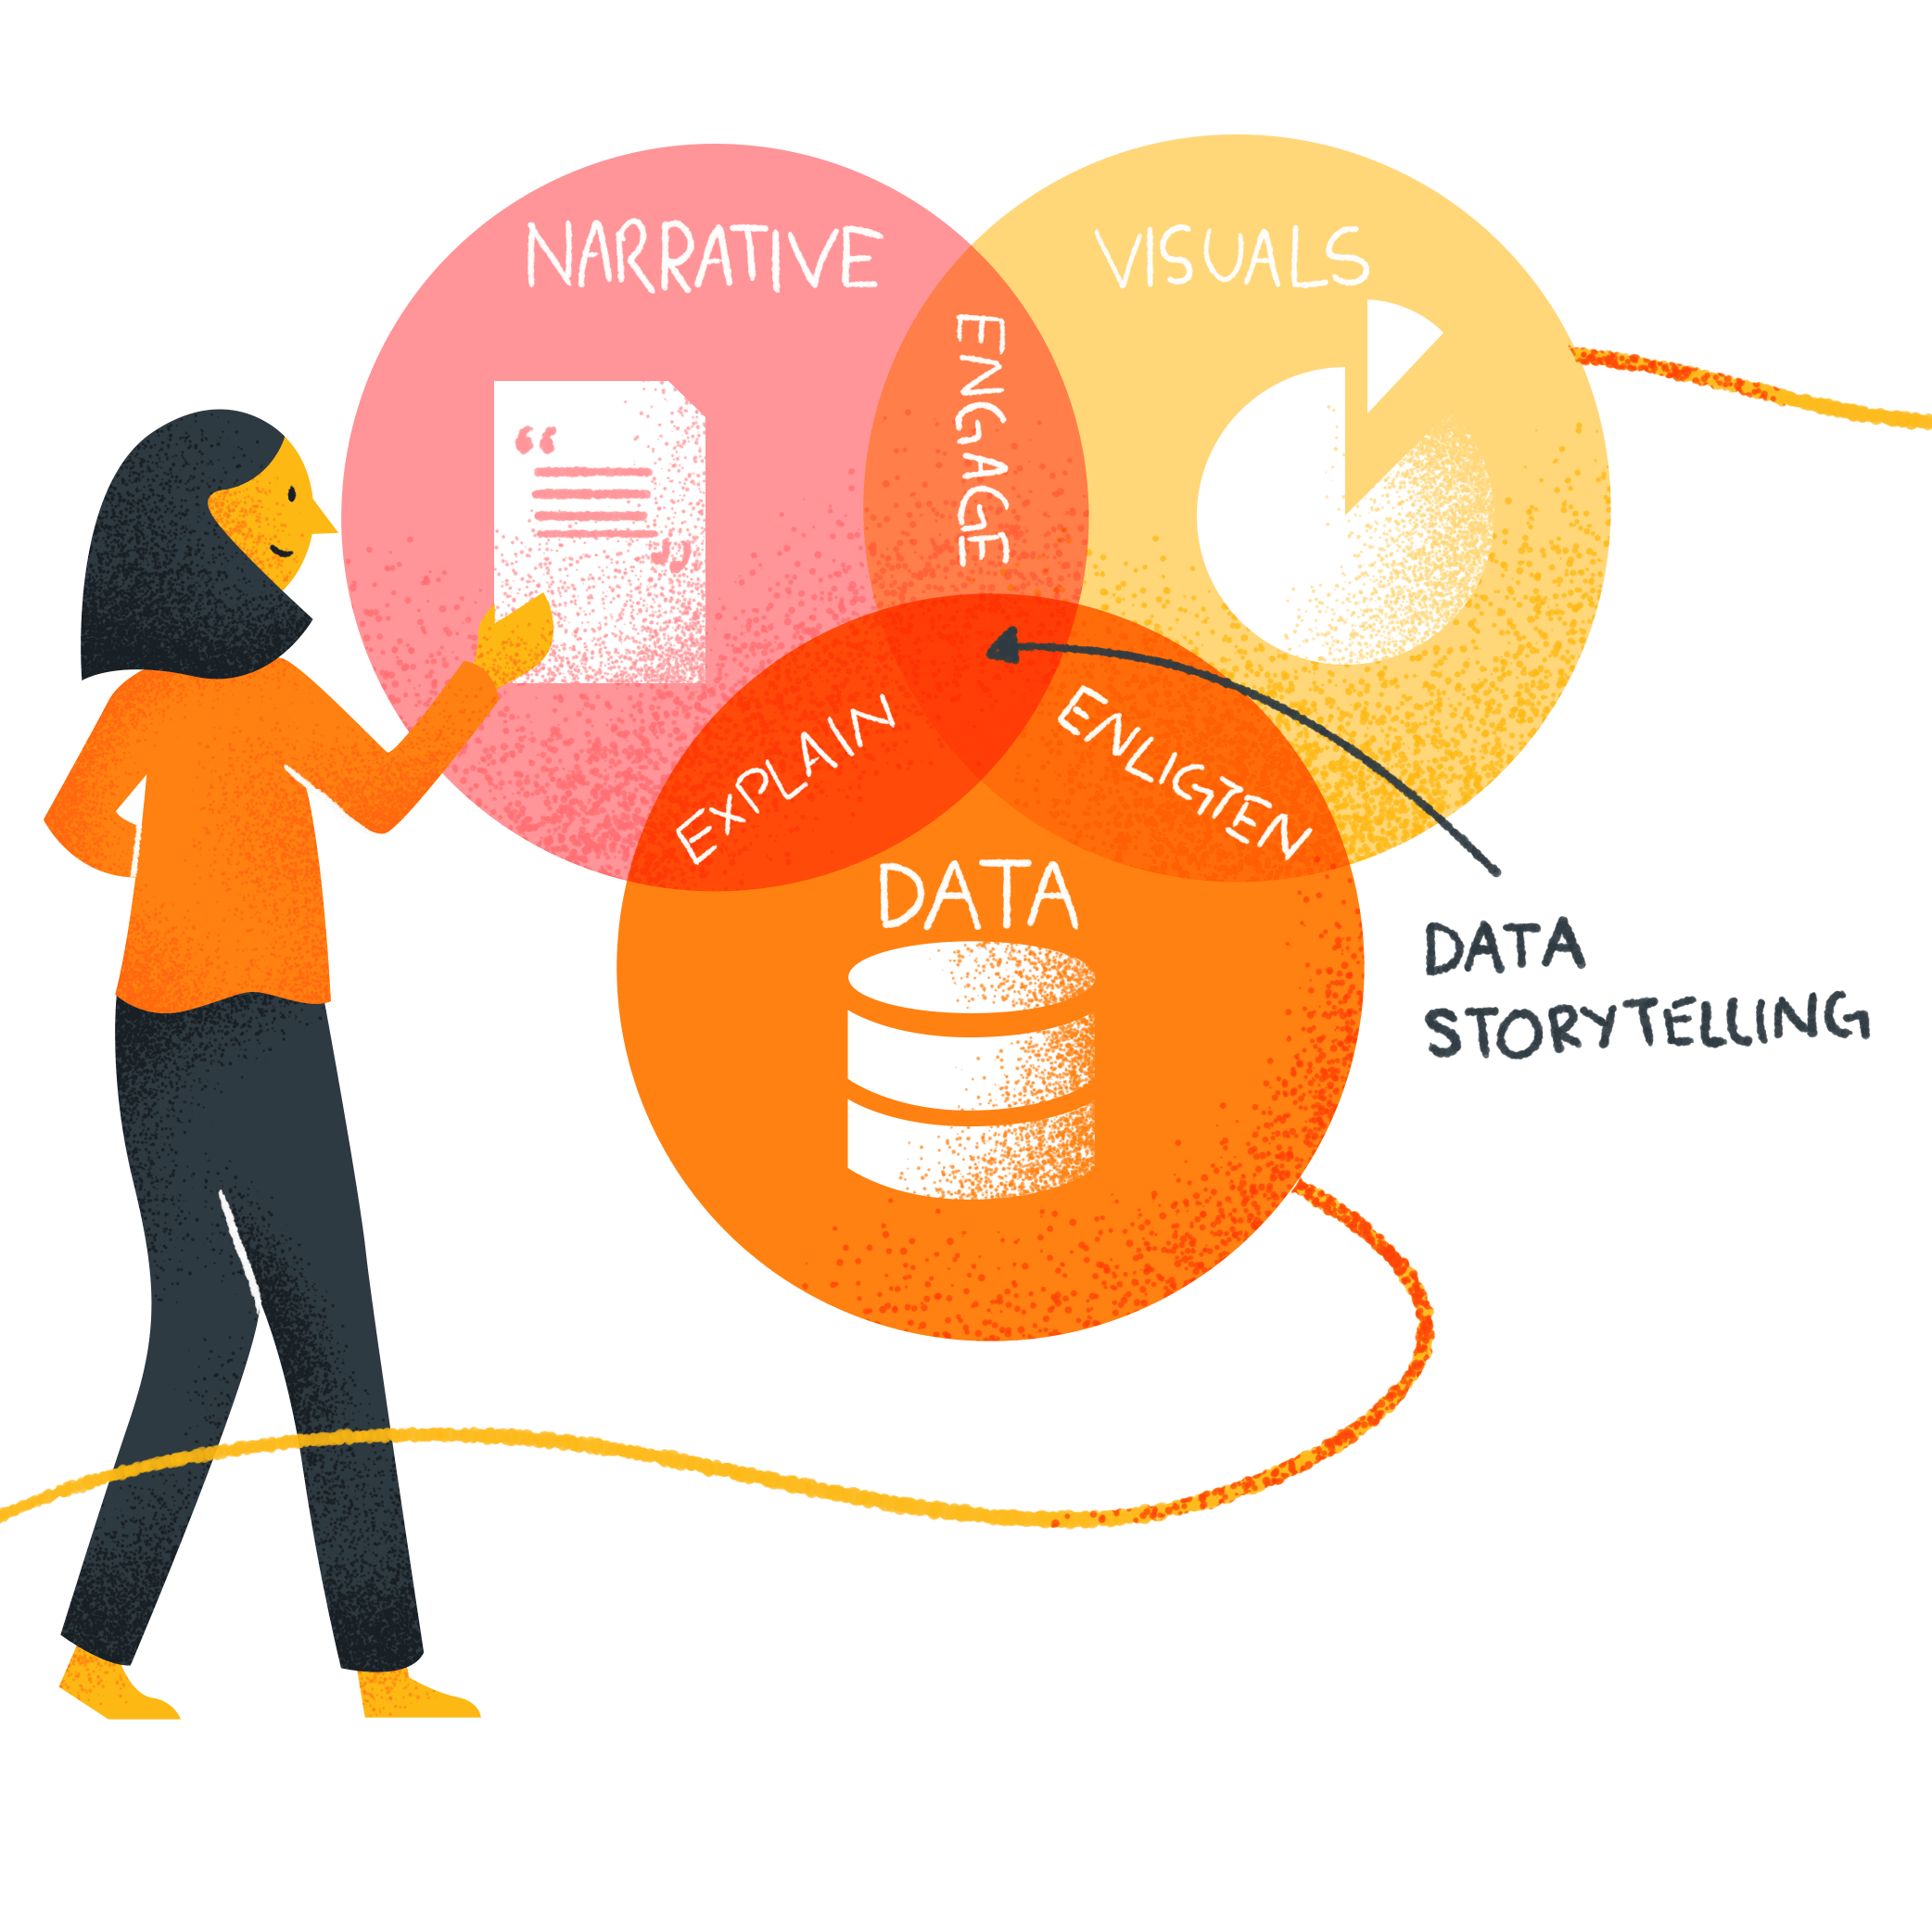
Enter the art of data storytelling – an explosive fusion of facts and fiction that has become the standard for today’s discussion.
Data storytelling is more than simply presenting data. It’s also about creating a narrative that makes the data come to life. It’s about giving numbers character, making trends real, and transforming key insights into action. The ability to communicate difficult concepts in a way that resonates is more important than ever in a society where attention is the most prized commodity.
Think about this: Static infographics, the formerly revered champions of visual data display, are fading in popularity. Traditional infographics find it difficult to effectively communicate insights of a good data story. This is because the attention spans get shorter, and the digital world cries out for dynamic involvement. In the age of motion pictures, they resemble old photographs.
|
Discover the most relevant agencies for your project based on your own specific requirements.
Find an agency!
This is where interactive data storytelling emerges as a viable solution for modern-day businesses. A data story is a concept that promises to immerse people in an experience as well as data visualisation. So, think of a canvas where facts dance at your fingertips. It is like every encounter reveals new levels of understanding, and where you, the explorer, choose the narrative’s course. It is a bridge from passive consumption to active engagement that mixes information, data tools, and interaction.
We’ll explore interactive data storytelling. We learn how the connections that connect a data story to contemporary communication as we go along. Therefore, this will help us see how it defies the limitations of static representation. A display that immerses the viewer in a narrative that they can touch and even shape.
Join us on this journey where data stops being just numbers and becomes a seamless symphony of connection and meaning.
Are you prepared to explore a new aspect of storytelling?

The Rise of Interactive Data Storytelling
Traditional static information is falling into oblivion in the dynamic digital world when every swipe and click expects involvement. Thus, his setting has laid the groundwork for the emergence of the Interactive Data narrative. A phenomenon that combines technology, narrative, and data-driven insights into an immersive experience.
Users need material that not only informs but also engages them as their attention spans get shorter. With 91% of customers choosing interactive and visual material over conventional formats, there is no denying the trend toward interaction. Interactive data storytelling enables users to actively participate in the discovery of information. This has grown in popularity as a result of this need for involvement.
Moreover, data scientists may go deeper into the data by using contextual clues. This way, the data storytelling culture provides a multifaceted toolbox by uncovering key insights and personalisation in the interaction. So, it turns data from merely statistical information of data analysis into a story that users can decipher and absorb at their own leisure. In actuality, research demonstrates that interactive content produces two times as many conversions as passive material.
Creators can develop interactive tales with the use of technologies like HTML5, JavaScript frameworks, and data visualisation tools. Platforms like Tableau and H5P offer the framework for complex and flexible representations. The use of these applications promotes a time when consumers not only consume but also actively interact with data.
This rise is more than simply a trend. It is a new mode of communication that coincides with the essence of human curiosity. It urges us to explore, discover, and learn.
Benefits of Interactive Data Storytelling
Interactive data storytelling is a shining example of efficient communication since it has a number of advantages over more conventional static ways.
1. Enhanced understanding and Engagement: Interactivity enthralls audiences like never before. According to studies, interactive content increases page views by 4-5 times and time spent on a page by 62%. Interactive stories create stronger connections by actively immersing people. It ensures that info is not only provided but also experienced. Thus this point comes across as one of the key performance indicators of an effective data story.
2. Personalised Exploration for Better Comprehension: Giving people the freedom to explore data at their own pace empowers them. This independence encourages improved comprehension and memory as compared to numbers-based data analysis. Research demonstrates that individualised e-learning experiences increase information comprehension by 40%.
3. Real-Time Updates for Dynamic Insights: The information landscape is always changing. Providing real-time data insights that reflect current trends and changes, interactive data storytelling enables seamless updates and facilitates quicker business decisions. Thus, the intended audience is kept informed and interested by this dynamic feature by encouraging an emotional response, which improves the relevancy of the material.
Interactive data storytelling is a new kind of information delivery that is emerging as the world of data science develops. It also serves as a transformative engagement tool that converts complex information into a visual story. This way, the data storyteller enables a fuller, more immersive comprehension of complicated storylines associated with the data.
Examples of Interactive Data Storytelling
A revolution in information presentation, comprehension, and acceptance is occurring as a result of interactive data storytelling, which has an influence on all industries.
1. Journalism: Interactive graphics augment conventional news storytelling. Readers may examine a database of police deaths in the US through The Guardian’s “The Counted” initiative. This initiative promotes a broader understanding of the problem. These interactive elements in the data story contribute to a 33% increase in the amount of time people spend on news websites.
2. Education: Immersive experiences enhance the learning process. For a variety of areas, Wolfram Alpha provides interactive simulations that let students try out ideas in real-time. According to studies, these opportunities increased student involvement by 74%.
3. Marketing: To create enduring relationships, data experts harness the potential of interactive marketing via data story in their marketing campaigns. The “Place” app from IKEA uses augmented reality to let users see furniture in their area. The application use has increased app engagement by 98% and sales conversions by 600%.
4. Science: Interactive visuals make difficult scientific topics understandable. Users may explore recently found exoplanets using NASA’s Eyes on Exoplanets. The database transforms difficult data into an engaging experience that promotes knowledge.
These instances show how interactive data storytelling crosses boundaries to spread information, promote learning, increase brand loyalty, or explain scientific marvels. It ushers in a new era of communication by fusing knowledge with interactivity. The application enables users to explore, comprehend, and participate like never before.
Key Components of Effective Interactive Data Stories
Impactful interactive data stories require a careful balancing act of components that captivate, inform, and empower the audience.
1. Navigation: It’s crucial to take users smoothly through a good data story. Users may easily and without getting lost, explore the tale, thanks to intuitive navigation interfaces as a form of data visualisations. This interface improves user experience and increases conversion rates by 200%.
2. Contextualisation: Context is essential for giving meaning to the data story. Giving consumers background information makes it easier for them to understand the relevance of the facts they are going to explore. This contextual approach via relevant data improves user comprehension by 40%, creating the foundation for a more knowledgeable investigation.
3. Layered Information: A strategic method for gradually unlocking valuable insights is progressive disclosure in the data story. So, this strategy is similar to storytelling, which keeps people interested by gradually exposing information. 60% of consumers like it, making it a tried-and-true strategy.
4. User Interaction: User interaction is at the centre of interactivity. Users can gain insights specific to their requirements by giving them the ability to edit and adapt data visualization. Visualizing data with slice-and-dice of a data component enhances user interaction. An increase in information retention of 70% is a result of such participation in learning more about the complex data in front of them.
5. Call to Action: Powerful data stories urge action in addition to merely informing via data visualisations. A data analyst will accelerate action by the decision makers by leveraging data visualization out of so much data. Encouraging people to act on their findings adds a transformational aspect to the experience. An effective call to action may convert engagement into action by increasing click-through rates by 371%.
An interactive data story is a powerful tool that creates a dynamic relationship with people by fusing these elements. A compelling story is a symphony of factors that guarantees people don’t just take in information but actively participate in it after the data storytellers gather insights and present it to them. So, the data is turned into an investigation, an understanding, and a call to action. These three key elements help the data collected to transform into actionable intel.
Tools and Technologies for Creating Interactive Data Stories
Creators may create immersive narratives to tell a story that connects with their audience. They accomplish this using a variety of potent tools and technologies available in the interactive data storytelling toolkit.
1. Tableau: Tableau is a pioneer in data visualization and offers a wide range of interactive capabilities, such as real-time dashboards and dynamic charts. 86% of Fortune 500 firms are drawn to it because of its drag-and-drop interface, which makes exploring data easier.
2. D3.js: This JavaScript toolkit offers unmatched control over data visualization. D3.js enables developers to design personalised dynamic graphics that support a distinctive data story by tying data to a Document Object Model (DOM).
3. StoryMapJS: StoryMapJS integrates maps and multimedia, making it ideal for geographic tales. It enables developers to lead people on interactive journeys while crafting stories replete with facts that are interesting and instructive.
4. H5P: An open-source platform that gives producers the ability to create interactive content, such as presentations, movies, and quizzes. Its adaptability draws more than 9000 websites, allowing dynamic learning opportunities.
5. Responsive Design: Beyond just being a tool, responsive design is essential. Making interactive tales that fit different devices and screen sizes is essential as mobile internet usage overtakes that of the desktop.
These technologies each have a special function in the creation of interesting interactive data tales. But beyond the technical, user experience and responsive design are what really matter. The fusion of technology and design accelerates interactive data storytelling into a space where accessibility, comprehension, and engagement flourish.
Challenges and Considerations
While interactive data storytelling offers a revolutionary approach, it also comes with a number of difficulties that need cautious handling.
1. Design Complexity: Finding the ideal harmony between form, function, and usability may be challenging when telling a data story. Users place a high priority on design, with 38% of site visitors leaving if the design is ugly.
2. Technical Restrictions: In an age of varied devices and browsers, compatibility is essential. Since 85% of people think a company’s website should function smoothly on mobile devices. Thus, removing technological obstacles guarantees a flawless experience.
3. Data Integrity: Interactive data must be accurate and reliable at all times. Inaccurate information can cause misunderstandings and disinformation, which undermines the credibility of the story.
· Best Practices and Advice:
1. Prioritise User Experience: Put the demands of the user at the centre of the design process. This step makes sure that form and function work in harmony when you tell a story.
2. Test Across Devices: Thorough testing across a range of platforms and browsers ensures a uniform user experience and reduces compatibility issues.
3. Data Validation: Implement strong data validation procedures to guarantee the precision and integrity of interactive data. This step will also help in various data analyses.
Therefore, creators can traverse the complex world of interactive data storytelling by identifying these difficulties and using best practices. This will enable them to produce a gripping data story that informs and inspires.
The Future of Interactive Data Storytelling
The trajectory of interactive data storytelling is developing with extraordinary potential as we look into the horizon of technology development. This evolution has the ability to significantly alter the data journalism and data analytics environment.
- New developments and trends:
1. Augmented Reality (AR) and Virtual Reality (VR): The combination of interactive data storytelling with augmented reality (AR) and virtual reality (VR) allows a view into immersive worlds. Users may enter a data story, turning intangible ideas into concrete experiences. By 2026, it is anticipated that the market for AR and VR will surpass $250 billion.
2. AI-driven Interactivity: Personalisation is entering a new age thanks to artificial intelligence. A clear data story may be tailored to each user’s tastes. This can be achieved by using AI to evaluate user activity and preferences. When you analyze data on this aspect you get a chance to provide relevant information. In 2025, the AI market is anticipated to reach over $190 billion. This says a lot about the proliferation of AI as businesses strive to provide more valuable insights.
- Interactive elements in narratives:
Despite these advancements in technology, the fundamental principle of narrative has not changed. Interactivity can enhance storytelling, yet a compelling narrative still has a strong emotional impact. According to research, tales are 22 times more remembered than just facts.
Interactive data storytelling’s future depends on finding a balance between innovation and the human touch. It is a communication paradigm where engagement, comprehension, and connection are more intertwined than ever before. Narratives will continue to be the heartbeat and interactivity the pulse as technology advances.
Conclusion: Forging a New Era of Communication
Interactive data storytelling emerges as a lighthouse of contemporary communication in an information-overloaded world. Its benefits, such as increased engagement and individualised comprehension, signal a new era in which data is not only consumed but also experienced.
One needs to connect with interactive and effective data storytelling directly in order to fully understand its transformational potential. Discover insights and take in a fusion of knowledge and engagement that redefines business intelligence.
Thus, the potential of successful data storytelling to influence the future of communication is apparent as we stand at the intersection of technology and narrative. With the help of new technology and the craft of storytelling, it is evolving in ways that promise to make society more connected, knowledgeable, and creative.
If you would like to know the correct marketer or data scientist to connect with, then check out Sortlist. We are the source for talent hiring that will help your business meet its goals. For more information on our abilities, you can explore our website.